I can quite distinctly remember when, as a teenager, I realised that I would spend much of my life debugging. I was programming in assembler, where loops are simply branch statements to defined labels. Because loops are so common, one would use the same label for each loop; later loops would redefine the label, meaning that no problems could occur. Being a literal person I used the label loop for all such loops. When one of my programs mysteriously failed, I could not work out why. Eventually I realised that one of my label definitions had spelt looop (three O’s instead of two) instead of loop, so my loop had branched back to the previous loop in the file. Spotting that took me a couple of days.
Later, I realised that most programming errors fit into two broad categories: the obvious and the subtle. Obvious errors are those whose source can be easily pinpointed (even if fixing the problem takes a while). The subtle are typically those where cause and effect are separated, making identification of the root of the problem difficult (often, when eventually located, such problems are easily fixed). The looop problem above was, to a relative novice programmer, a very subtle problem (years of experience have taught me that looking for daft spellings in my own programs is a good initial target when debugging).
There are, to my mind, two tricks to debugging. The first is to try and turn subtle problems into obvious problems; however subtle problems are typically inherently subtle and unamenable to such treatment. The second is to try and speed up the solving of obvious problems. For me, the main tool for solving obvious problems is the humble backtrace which, when an exception occurs, shows one (in some manner or another) the call stack and, hopefully, what file and line number each entry therein is associated with. Given the following trivial program:
func head(l):
    return [l[0], l[1 : ]]

func main():
    head([1])
    head([])
a standard looking backtrace would be:
Traceback (most recent call at bottom):
  1: File "/tmp/head.cv", line 6
  2: File "/tmp/head.cv", line 2
  3: (internal), in List.get
Bounds_Exception: 0 exceeds upper bound 0
Using this we can fairly quickly see that the cause of our error is passing an empty list to a function which assumes that there is at least one element in the list. [As a side note, this example is in one way unrepresentative: in the vast majority of cases, it’s typically the bottom one or two lines of the backtrace that pinpoint the real source of the error.]
Backtraces like the above can be found in most modern programming languages like Java. They are immensely useful and form precisely half of my debugging toolkit, the other half being printf - in my view of the world, these two tools obviate the need for debuggers. The power of backtraces is most obviously felt in those languages that don’t have them. C programs typically need to be run through a debugger to get a backtrace, meaning that errors in programs running in production can be extremely difficult to diagnose. The first Haskell program I wrote had the head error in it. The resulting message just said Prelude.head: empty list with nothing else to help me - no line numbers or even file names. Needless to say, it took me a long while to work out what this meant, and how it happened (if I remember correctly, I passed an empty list to a library function which, in turn, called head). Unsurprisingly that was also pretty much the last program I wrote in Haskell - languages that turn should-be-obvious errors into subtle errors are of no use to me. [Apparently Haskell now has some in-built, though hardly easy to use, support for backtraces. The implications relating to Haskell’s prioritisation of features are, to my mind, highly amusing.]
Python was the first language I saw that took backtraces a little bit further, printing (when possible) the line of source code associated with each part of the backtrace. A Python-esque backtrace looks roughly as follows:
Traceback (most recent call at bottom):
  1: File "/tmp/head.cv", line 6
       head([])
  2: File "/tmp/head.cv", line 2
       return [l[0], l[1 : ]]
  3: (internal), in List.get
Bounds_Exception: 0 exceeds upper bound 0
This simple innovation is a real boon: as in this case, one often doen’t even need to open a source file in a text editor to see the error made. Python-esque backtraces help make obvious errors quicker to solve than traditional backtraces.
I realised early on in Converge’s development that knowing merely the line number of an error was only part of the problem. Often a specific sub-expression within a certain line is the relevant part of the backtrace, and the rest of the line is noise. Converge therefore recorded the column (i.e. offset within a line) where each error is associated with, meaning that backtraces looked like the following:
Traceback (most recent call at bottom):
  1: File "/tmp/head.cv", line 6, column 4
  2: File "/tmp/head.cv", line 2, column 13
  3: (internal), in List.get
Bounds_Exception: 0 exceeds upper bound 0
This extra information is very helpful: it means that I can accurately pinpoint which of the two list lookups in line 2 is responsible for calling List.get incorrectly. As a useful advantage, Converge’s approach also means that errors that happen within multi-line statements (i.e. logical lines of source split over multiple physical lines in a source file to aid presentation) work properly.
Converge’s backtraces stayed like the above for quite some time, until recently when I realised that knowing the start column associated with an error is only part of the story. What one really wants to know is the start and end of the associated expression. A small tweak to the parser, and a huge (but mechanical) change to the compiler, and Converge backtraces could tell one how many characters in the line an error was associated with:
Traceback (most recent call at bottom):
  1: File "/tmp/head.cv", line 6, column 4, length 8
       head([])
  2: File "/tmp/head.cv", line 2, column 12, length 4
       return [l[0], l[1 : ]]
  3: (internal), in List.get
Bounds_Exception: 0 exceeds upper bound 0
This is almost helpful, but in practice I find it surprisingly hard to count n characters within a line on screen, which hinders interpretation of the above data.
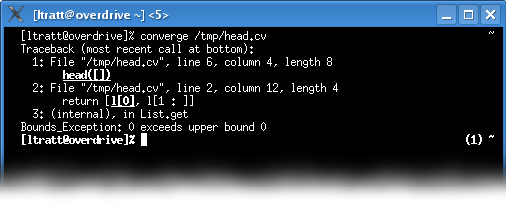
A short while later, the answer hit me: what the backtraces need to do is to highlight the relevant sub-expression within the line. Here’s a screenshot of the above error running in an xterm with the latest version of Converge:

As you might notice, the tiny little difference here is that the part of each line pertinent to the error is in bold and underlined. Knowing that, one can instantly see that the first of the two list lookups on line 2 is responsible for calling List.get incorrectly. Interestingly, my first attempt at this put the offending fragments only in bold, but since whitespace can sometimes be a significant part of an error, underlining can be a useful aid. In the case where the associated source code is split over multiple lines, the first relevant line of source code is printed with ... added to the end of the line to inform the user that the printed line is not the end of the story.
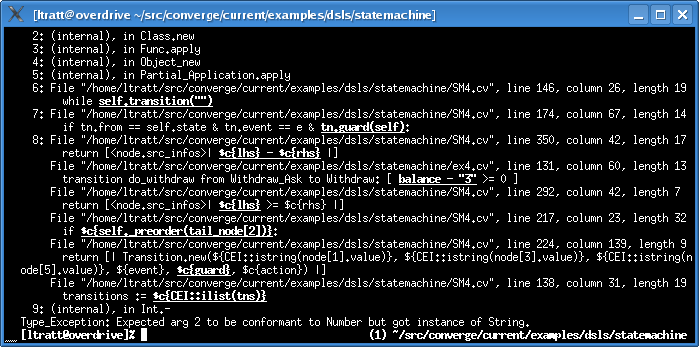
As I explained in a previous entry, when Converge DSLs are translated into Converge ASTs, individual call stack entries can be associated with more than one source location. This means that backtraces tend to be rather long, which previously made tracking down the cause of an error tedious - loading multiple files into text editors and continually flipping back and forth to xterms is not fun. Extended backtraces become a real life saver in this regard. Here’s an example where a DSL incorrectly tries to subtract a string from an integer:

Looking at this backtrace, an experienced programmer will be able to quickly surmise that, given the exception message, the most likely candidate for this error is in the ex4.cv file (which, as the eagle-eyed may notice, is code written in the DSL - Converge’s errors work with both the base language and with embedded DSLs). Imagine trying to debug this with a traditional backtrace: there’s a lot of information in the backtrace, and there would be no indication as to which part of it is more likely to be responsible for the error.
From a practical point of view, Converge’s extended backtraces have no run-time penalty for correct code, and users don’t have to do anything to enable them - they’re a standard part of the system. Extended backtraces can be found in -current versions of Converge (at the time of writing, Converge’s support for Curses under Windows is weak, so underlining doesn’t work there - it’s a quick, fun little project for someone who’s interested).
So, going back to the start of this entry, how do Converge’s extended backtraces help with debugging? Well, they might help turn the odd subtle error into an obvious error, but that’s an incidental benefit. What I think they do is make solving obvious errors much quicker than previously. In the sort time since I’ve had extended backtraces, I’ve noticed that I’ve often been able to almost instantly fix errors that before might have taken me a couple of minutes. Given the number of programming errors I make, the cumulative time saving is most welcome.
In summary, I think that Converge’s extended backtraces are a real boon to programming. To the best of my knowledge, Converge is the first language with such backtraces in - I hope it won’t be the last!