In the first part of this two-part blog, I showed results from an experiment on VM performance that I’d been part of. Although it wasn’t our original intention, we eventually ended up trying to find out how often mainstream programming language VMs warm up as per traditional expectations. If you consider only individual process executions, then about 70% warmup; if you consider (VM, benchmark) pairs, then about 40% warmup consistently; and if you consider (VM, benchmark, machine) triples, then about 12% warmup consistently.
However you choose to look at it, these numbers aren’t pretty. In trying to make sense of them, I’m going to try and provide some answers to the following three questions. First, are there simple explanations for the performance problems we encountered? Second, how did we get into this situation? Third, how can we do better in the future? To answer the first question, I’m going to draw on our paper. In providing suggested answers to the second and third questions, I’m going to be make extensive use of my personal opinions and experiences, so please don’t blame anyone else for them!
Are there simple explanations for poor performance?
There are all sorts of factors that might be responsible for odd performance, but, beyond those covered in the first part of this blog post, there are two that seem both particularly likely and relatively easy to test for: garbage collection and JIT compilation. For example, garbage collection is, to state the obvious, memory intensive: it could conceivably have all sorts of odd effects on processor caches and thus performance. Similarly, JIT compilation can happen at any point, and there’s no guarantee that it makes things faster.
We therefore took two of the VMs under examination – HotSpot and PyPy1 – and performed a second experiment, separate from the first2, where we also recorded how long each in-process iteration spent in garbage collection activities and JIT compilation. To be clear, the aim of this second experiment wasn’t to find causations (i.e. to find definitive reasons for odd performance), but to see if there are plausible correlations (i.e. good candidates for further investigation).
Here’s an example plot from this second experiment:

There are three sub-plots in this plot. All share the same x-axis of
in-process iterations (i.e. the benchmarking running in a for
loop). The “main” sub-plot (the bottom of the 3 sub-plots), is the same as in
the first part of this blog, with its y-axis showing the wall-clock time that
each in-process iteration takes. In the example above, we can see something odd going on in
fasta on PyPy: there are 3 main “sections”, but instead of
each “section” having fairly consistent performance for each in-process iteration, they seem to get
gradually slower over time.
The top two sub-plots show the time spent in garbage collection and JIT compilation for each in-process iteration3. These clearly show that JIT compilation only happens right at the very beginning of the benchmark. However, the time spent in garbage collection is almost perfectly correlated with the overall performance of the benchmark. That suggests first that this benchmark is spending most of its time in garbage collection, and second that there may well be a minor memory leak (in the VM or the benchmark). Again, to be clear, I’m only claiming a correlation, not a causation. However, if I wanted to fix this, I know that I’d start looking for memory allocation sites that don’t seem to be freeing up memory.

Here’s my old friend, Richards running on HotSpot: this benchmark gets 5% slower at about iteration 200, ending up in a steady state of non-peak performance. We can see that we’re regularly spending time garbage collecting4, but there’s no correlation between garbage collection spikes and the main sub-plot. However, the JIT compilation sub-plot is more interesting: just before the benchmark slows down, there are two long-ish JIT compilation events. It therefore seems plausible that the VM decided to recompile parts of the benchmark (probably based on extra profiling data it had collected), but that the recompilation led to slower machine code being generated. Again, it’s not a guaranteed causation, but it does give a pointer for where to look. However, it’s a less useful pointer than the previous example. Since JIT compilers are, to put it mildly, rather complex, fingering the JIT compiler as a culprit still means considering a huge amount of code as the likely cause of the problem.

This third example shows a more troubling case. This is the shallow square-wave example we saw in the first part of this blog (you can see the original plot if you want a reminder). It shows two things. First, turning on profiling changes the nature of most process executions: instead of appearing almost immediately, the square wave doesn’t appear until the thousandth iteration; and the “steady-ish state performance“ is better with profiling on (roughly 0.34-0.36s with profiling on vs. 0.36-0.40s with profiling off). Second, no matter how much you look, there is no correlation between garbage collection (indeed, no garbage collection occurs at all!) or JIT compilation and the square wave. You might get excited by the JIT compilation event around iteration 1375, which seems to correlate with the third trough, but there’s no such correlation at the start of any of the other troughs. I honestly don’t have a clue what’s causing the square wave, and there’s nothing here which gives me the slightest pointer as to what I should look at first.
Unfortunately, a lot of examples look like the second or third cases: the correlation only points us to a still-very-large subset of the VM; or doesn’t point us anywhere at all. Indeed, more recently I was involved in a LuaJIT performance project where we also extracted profiling information about garbage collection and JIT compilation. While this information was helpful sometimes, I wouldn’t say that it was a decisive advantage. In some cases, despite the plots not showing anything obvious, we later traced problems back to the garbage collector or the JIT. There are clearly several possible causes for this, but my guess is that the most common is that the consequences of performance problems are often spread around somewhat evenly, thus not showing up as a visible spike at a particular point in time.
There seem, therefore, few simple answers to the odd performance I pointed out in the first part of this post. How did we get into such a situation? Realistically, the answer is almost surely “for lots of reasons, many of which we’ll probably never know.” However, I have a couple of war stories that I think might provide a partial explanation, and that look at things in a slightly different way than I’ve heard others talk about in the past.
Are benchmark suites complete guides to performance?
At the risk of stating the obvious, most of us use benchmarks to guide our optimisations. In other words, if we think we’ve made a compiler faster, we have one or more programs which we measure before and after the change to see if the it really has made things faster or not (and, if it has, by how much). In general, people use multiple such programs, at which point we bestow upon them the grand title of a “benchmark suite”. Optimisations which make our benchmark suite run faster are good; those that make our benchmark suite run slower are bad. But do our benchmark suites tell us about the performance of programs in general?
Some of you may remember that a few years back Dropbox started a new Python VM project called Pyston5. I was a bit surprised at the time, because VMs are notoriously a lot more work than people think, and PyPy was already a pretty good Python VM by that point. Still, I didn’t think much more about it, until I happened to bump into Kevin Modzelewski, one of Pyston’s creators, at a conference a year or two later. I had a very interesting conversation with him, as part of which I asked him why Dropbox had decided to create a brand new Python VM. Simplifying things a bit, he said that PyPy performed badly on some common Dropbox idioms, and that he’d distilled the worst offender down to a benchmark where PyPy (a clever JIT compiler) was over 4 times slower than CPython (a simple interpreter).
Looking at the benchmark, the problem became clear very quickly: it was recursive. To my surprise, RPython (the language/framework in which PyPy is written) was unrolling6 all recursive calls. Unrolling is a powerful, but dangerous, optimisation: it can make programs faster when used judiciously, but used incautiously it causes code bloat and degraded performance. Since unrolling all recursive calls is akin to unrolling all loops, this seemed unlikely to be a good idea. I quickly confirmed with the core developers that this wasn’t an intended outcome, and that it was a natural property of tracing’s naturally aggressive tendency to inline.
I thought this was would be a fun problem to debug, as it involved a part of RPython that I had not previously looked at. It took 2 or 3 days before I had found the right part of RPython, worked out what was going on, and found a fix. The core of the resulting diff is fairly simple:
diff --git a/rpython/jit/metainterp/pyjitpl.py b/rpython/jit/metainterp/pyjitpl.py
--- a/rpython/jit/metainterp/pyjitpl.py
+++ b/rpython/jit/metainterp/pyjitpl.py
@@ -951,9 +951,31 @@
         if warmrunnerstate.inlining:
             if warmrunnerstate.can_inline_callable(greenboxes):
+                # We've found a potentially inlinable function; now we need to
+                # see if it's already on the stack. In other words: are we about
+                # to enter recursion? If so, we don't want to inline the
+                # recursion, which would be equivalent to unrolling a while
+                # loop.
                 portal_code = targetjitdriver_sd.mainjitcode
-                return self.metainterp.perform_call(portal_code, allboxes,
-                                                    greenkey=greenboxes)
+                inline = True
+                if self.metainterp.is_main_jitcode(portal_code):
+                    for gk, _ in self.metainterp.portal_trace_positions:
+                        if gk is None:
+                            continue
+                        assert len(gk) == len(greenboxes)
+                        i = 0
+                        for i in range(len(gk)):
+                            if not gk[i].same_constant(greenboxes[i]):
+                                break
+                        else:
+                            # The greenkey of a trace position on the stack
+                            # matches what we have, which means we're definitely
+                            # about to recurse.
+                            inline = False
+                            break
+                if inline:
+                    return self.metainterp.perform_call(portal_code, allboxes,
+                                greenkey=greenboxes)
In essence, what this diff does is the following. When we’re tracing (roughly speaking, “JIT compiling”) and about to trace into a function F (implicitly identified here by the “greens”), we check the tracer’s call-stack to see if F is present. If it is, then inlining F again would be akin to unrolling, and we stop tracing.
Without worrying too much about the details, I hope you’ll agree that it’s a fairly small diff. What’s more, it’s effective: performance on PyPy improved by 13.5x (meaning that PyPy went from 4.4x slower than CPython to over 3x faster). At this point, I was patting myself on the back for a job well done, and indulging my ego by wondering if Dropbox would have created a new Python VM if this fix had been present.
However, there was a problem. Yes, I’d made one benchmark 13.5x faster, but PyPy has its own benchmarking suite. When I ran the above fix on PyPy’s benchmark suite of 20-odd benchmarks, 5 became slower (up to 4x slower). I knew that the core PyPy developers would, quite reasonably, not accept a performance “fix” that made performance of the main benchmark suite worse. First, I added a mechanism to control how many levels of recursion are unrolled. Second, I set about uncovering how many unrollings of recursive calls would recover the performance of the main PyPy benchmarks.
I thus did some basic benchmarking, putting this table in the email I sent to the pypy-dev mailing list:
     #unrollings |  1   |  2   |  3   |  5   |  7   |  10  |
-----------------+------+------+------+------+------+------+
hexiom2          | 1.3  | 1.4  | 1.1  | 1.0  | 1.0  | 1.0  |
raytrace-simple  | 3.3  | 3.1  | 2.8  | 1.4  | 1.0  | 1.0  |
spectral-norm    | 3.3  | 1.0  | 1.0  | 1.0  | 1.0  | 1.0  |
sympy_str        | 1.5  | 1.0  | 1.0  | 1.0  | 1.0  | 1.0  |
telco            | 4    | 2.5  | 2.0  | 1.0  | 1.0  | 1.0  |
-----------------+------+------+------+------+------+------+
polymorphism     | 0.07 | 0.07 | 0.07 | 0.07 | 0.08 | 0.09 |
Looking back, I’m slightly embarrassed by the quality of benchmarking this represents, but I hope you’ll forgive me for that. The top half of the table (from hexiom2 to telco) represents the subset of PyPy benchmarks that my fix had slowed down. For example, with 1 unrolling of recursion (i.e. equivalent to inlining the function once but performing no further “unrolling”), raytrace-simple ran 3.3x slower than under “normal” PyPy; with 2 levels of unrolling it ran 3.1x slower; and by 7 levels of unrolling my branch and normal PyPy ran the benchmark at the same speed. On the bottom row is Kevin’s benchmark (which, for reasons I can no longer fathom, has timings in seconds): it’s fastest at 1 unrolling, but even at 7 unrollings it’s only lost a bit of performance.
The table above clearly shows that RPython should unroll recursive function calls 7 levels deep. On that basis, my email to the PyPy list proposed that number; that was the number that was merged into RPython; and that’s the number that’s still used today.
However, I doubted at the time that 7 was the right value and today I’m almost positive that it’s not the right value. I’m almost certain that the right value is going to be much closer to 1 — indeed, probably 1 itself. There’s no doubt that simple recursive function calls (of the sort found in many of the PyPy benchmarks) benefit from unrolling. However, if unrolling every loop was a good idea, we’d expect every static compiler to do it, — but they don’t7. Recursive functions are like loops, but worse: functions are, by definition, bigger than loops on average. However, in the context of tracing, my reasoning is that we care a lot more about the worst case of unrolling than we do the best case. My major concern is that recursive functions are often heavily data dependent. A common example of this are the tree walkers found in compilers, which walk over an abstract syntax tree and compile the program. In such cases, the recursive function looks at a node, does something based on that, and then visits the node’s children. The challenge with this is that the path the recursive function depends entirely on the structure of the input tree. This means that the amount of code executed between each call of the recursive function can vary hugely: we frequently end up tracing paths which are never used in full again. The problem is that meta-tracing is a very expensive activity, causing execution to temporarily slow down by around a couple of orders of magnitude: tracing things that aren’t used again can lead to significant performance losses. Even worse, these losses are often invisible, in the sense that it’s not really a flaw in the user’s program, but an often inevitable mismatch with the dynamic compilation approach.
Realistically, no benchmark suite can ever be complete, in the sense that it can claim to represent the performance behaviour of every possible program. A better question is whether the benchmark suite is representative of a fairly large subset of programs. The above example shows that PyPy’s standard benchmark suite doesn’t cover some fairly common idioms. How many other common idioms aren’t covered? My strong intuition is that the answer is “many”. This isn’t to knock PyPy’s benchmark suite: indeed, it’s better than most other VMs’ benchmark suites. However, we often derive a false sense of comfort from benchmark suites: too often the phrase “this optimisation sped up the benchmark suite by 3%” is used interchangeably with “this optimisation speeds up programs by 3%”. The harsh reality is that our benchmark suites reject some optimisations that would make the vast majority of programs run faster, and accept some optimisations that make the vast majority of programs run slower. How often we get unrepresentative answers from our benchmark suites is anyone’s guess, but I fear it has happened more in the past than we imagine.
Are benchmark suites correct guides to performance?
The first war story might make you wonder whether or not benchmark suites tell us much about performance of programs in general. But a second issue with benchmark suites is whether the answer we receive is even correct with respect to the benchmark suite itself. Put another way, if a benchmark suite tells us that an attempted optimisation makes the benchmark suite faster or slower, is that answer reliable?
Alongside the main experiment I reported in the previous blog post, we also
(separately) benchmarked SpiderMonkey and V8 against the Octane benchmark suite.
Octane consists of 17 benchmarks, originally from V8; it fairly quickly became
one of the most important JavaScript benchmark suites. Despite
not knowing JavaScript at that point, I took on the task (“how hard can it be?”)
of getting Octane into shape8. In essence, all I did was put
in a for loop that ran each benchmark for 2000 in-process
iterations9. That done, I ran my slightly altered
Octane benchmark suite on d8 (the command-line way of running
programs on V8) and got the following output:
$ d8 run.js
Richards
DeltaBlue
Encrypt
Decrypt
RayTrace
Earley
Boyer
RegExp
Splay
NavierStokes
PdfJS

<--- Last few GCs --->

14907865 ms: Mark-sweep 1093.9 (1434.4) -> 1093.4 (1434.4) MB, 274.8 / 0.0 ms [allocation failure] [GC in old space requested].
14908140 ms: Mark-sweep 1093.4 (1434.4) -> 1093.3 (1434.4) MB, 274.4 / 0.0 ms [allocation failure] [GC in old space requested].
14908421 ms: Mark-sweep 1093.3 (1434.4) -> 1100.5 (1418.4) MB, 280.9 / 0.0 ms [last resort gc].
14908703 ms: Mark-sweep 1100.5 (1418.4) -> 1107.8 (1418.4) MB, 282.1 / 0.0 ms [last resort gc].

<--- JS stacktrace --->

==== JS stack trace =========================================

Security context: 0x20d333ad3ba9
    2: extractFontProgram(aka Type1Parser_extractFontProgram) [pdfjs.js:17004] [pc=0x3a13b275421b] (this=0x3de358283581 ,stream=0x4603fbdc4e1 )
    3: new Type1Font [pdfjs.js:17216] [pc=0x3a13b2752078] (this=0x4603fbdaea9 ,name=0x4603fbd9c09 ,file=0x4603fb...

#
# Fatal error in CALL_AND_RETRY_LAST
# Allocation failed - process out of memory
#

zsh: illegal hardware instruction  d8 run.js
I can very distinctly remember having a sinking feeling when I saw that. Fortunately, when I looked at it more closely, it became clear that the situation wasn’t as bad as I had first feared. Starting from the top of that output, you can see that a number of Octane’s benchmarks (from Richards to NavierStokes) ran successfully, before PdfJS caused d8 to fail. A cursory look at the error message shows that PdfJS failed because V8 had run out of memory. I decided to have a quick look at whatever timing outputs I had got (bearing in mind that this was done without Krun, so it’s so-so benchmarking) before the crash and plotted them:

That graph looks interesting, and there’s a clear blow-up towards the end, but there’s not quite enough data to see if there’s anything meaningful going on before that. Fortunately, the way that I had made in-process iterations was to bundle several of Octane’s ‘inner’ iterations into longer ‘outer’ in-process iterations. I therefore reran things, this time recording how long each ‘inner’ iteration took to run:

Now this is starting to look interesting, but the huge spike at the end makes it hard to see the denser detail elsewhere in the plot. I therefore chopped the last 80 or so in-process iterations off and replotted:

At this point the likely source of the error became clear to me. The first half of this (sub-)plot has regular spikes, which grow roughly linearly: I guessed that they were the garbage collector running, which was probably having to do a little more work each time it was run. The second half of this plot shows a complete change in the timing data. I guessed that the garbage collector was probably going into some sort of low-memory mode, where it trades off memory for time, which causes it to run much more often, and to run much more slowly. It continually has to do more work, until – just to the right of this final plot – it explodes with an out of memory exception. If ever I’ve seen a plot which screams “memory leak”, this is it.
At this point, I had a very strong suspicion what the cause was, and a guess
that this was more likely to be a bug in PdfJS than V8. But how likely was it
that I would find a bug in a benchmark that was 33,053 lines of code
in a language which I didn’t know? Frankly, it sounded like a lost cause. Still,
I thought it would be worth having a look, so I loaded pdfjs.js
into my trusty text editor:
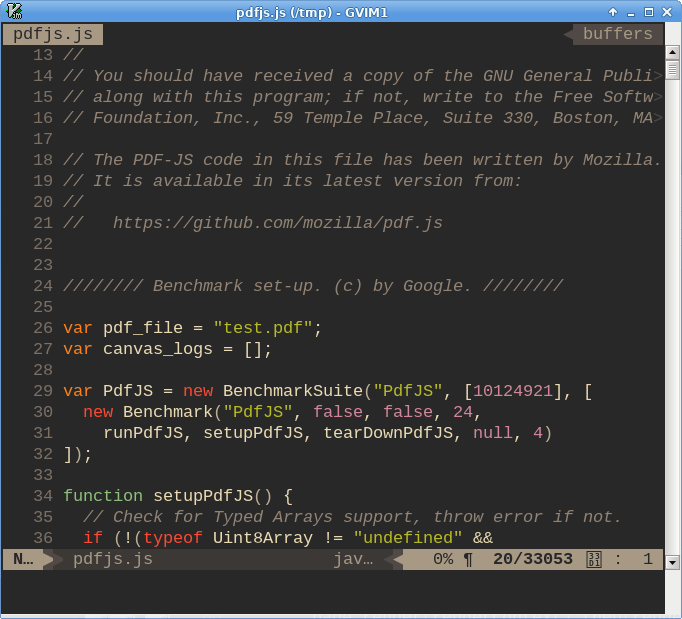
To my surprise, the second line of code after the licence was var canvas_logs = [];, which looked a lot to me like an assignment of a
mutable array to a global variable. That’s an obvious candidate for problems, but
surely far too obvious to be the bug. Still, I thought I’d see where
canvas_logs is used, just in case. I scrolled to the first use
of the variable in the file:
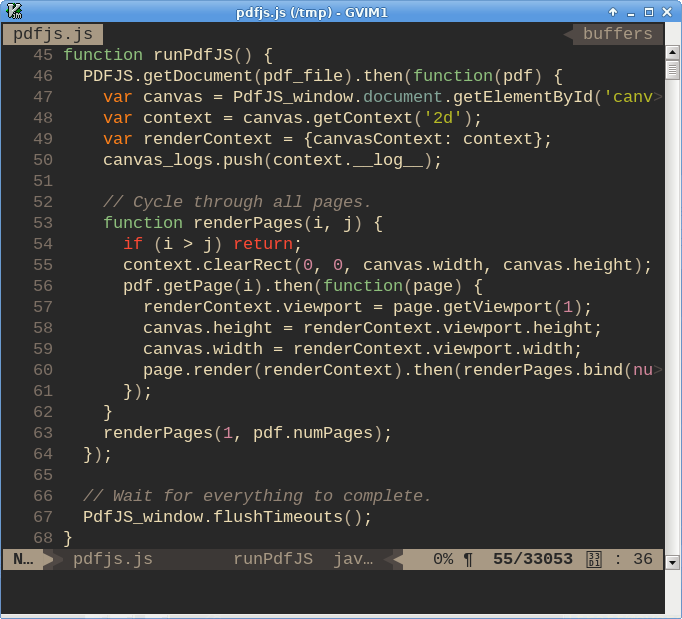
At line 50, it looked to me like content is being appended to the array, but nowhere in that function is anything being removed from the list. Indeed, there are 3 other references to this variable in the file, 2 of which check the array’s length, and 1 of which accesses elements in the array. Bingo! Within about 90 seconds, I had found the source of the memory leak. Emphasising my cluelessness with JavaScript, it then took me about 10 minutes to work out how to empty an array of its contents. Programming is a humbling job.
The fix to PdfJS’s memory leak is thus simply to add the line
canvas_logs.length = 0 to the beginning of the
runPdfJs function. However, to my regret, the fix has not been merged into Octane because, some time after I raised the PR, Octane was retired.
A reasonable question to ask is whether the memory leak in PdfJS is really a problem. Presumably not many other people have run the benchmark long enough to see the crash I saw. Besides, a benchmark’s job is to measure a VM doing some work and, whether there’s a memory leak or not, the PdfJS benchmark is certainly doing some work. This latter point is alluring but, I believe, dangerous. Let me give a couple of scenarios to illustrate this point.
First, it is common to add benchmarks to a benchmark suite when one perceives that they tell us something new about the compiler in question. For example, let’s imagine that I realise that my benchmark suite is light on benchmarks which measure changes to my VM’s code generator. I have a look around and, having profiled a couple of its in-process iterations, decide that PdfJS is the perfect way of addressing this weakness in the benchmark suite. Later on, I make a change to the code-generator which I hope optimises programs such as PdfJS. I run PdfJS for a while (after all, I know that I need to think about peak performance) and find out that the performance hasn’t changed very much, causing me to discard my changes to the code-generator. The problem here is that PdfJS isn’t really a test of a code-generator, rather it is a test of the garbage collector in low-memory situations. That’s not an unreasonable thing to benchmark, but it’s not what I expected PdfJS to be benchmarking10. My change to the code-generator might really have been an improvement, but it might have been overwhelmed by the time spent in garbage collection by this particular benchmark.
Second, many benchmark suites – including Octane – have a mode which says “run the benchmark for n seconds and then report how many in-process iterations completed in that time”. Let’s assume that PdfJS manages to complete 100 in-process iterations in 10 seconds. I now introduce a new, complex, optimisation into the VM, which makes my benchmark complete 101 in-process iterations in 10 seconds. It looks like I’ve got a 1% speed-up, which might not be enough to justify the additional complexity in the VM. However, if each in-process iteration does more work than its predecessor the real improvement is higher — potentially much, much higher (see the last few in-process iterations of the graphs earlier in this post).
In both the above examples, a faulty benchmark like PdfJS can cause us to systematically underappreciate, or exclude, effective optimisations. Although a little less likely, it’s also possible to imagine it having the opposite effect (i.e. causing us to include ineffective, or even deleterious, optimisations).
Still, you might well think that I’m banging on a bit too much about a single
faulty benchmark. All code has bugs, and it’s not surprising that some
benchmarks have bugs too. It’s not unreasonable to suggest that the odd bad
benchmark probably won’t lead us too far astray. However, when I looked
at Octane, CodeLoadClosure also has a memory leak11, and zlib complains that it “cannot
enlarge memory arrays in asm.js” (which might be a memory leak, although I
didn’t investigate further). In other words, a non-trivial portion of
Octane’s benchmarks appear to be misleading and it’s reasonable to assume that,
on occasion, they will have misled VM developers. Does this mean that Octane is
an unusually terrible benchmark suite? Probably not, but it’s certainly made
me even more cautious about benchmark suites than I was before.
Summary
Returning back to this post’s title: why aren’t more users more happy with our VMs? The conclusion I’ve been forced to is that our benchmarking and our benchmarks have misled us. In a perfect example of Goodhart’s Law, we’ve too often optimised for metrics that aren’t representative of what we really care about.
Fortunately, I think it’s possible to do a little better without undue effort. Here are my simple suggestions:
-
Running benchmarks for longer uncovers a surprising number of latent problems. Ultimately, all the odd performance effects we saw in part one of this blog post resulted from running benchmarks for longer than anyone had done before.
-
We must accept that neither peak performance nor a steady state is guaranteed to occur. Benchmarking methodologies that assume one or both of these concepts are fundamentally broken.
-
I think it’s intellectually dishonest not to report warmup time. There’s no doubt that warmup time is annoying and that it can paint VMs in an unflattering light. But by pretending it’s a non-issue we’re misleading users about what performance they can expect, and storing up long-term resentment.
-
We might be able to learn from the machine-learning community and separate out training benchmark suites (which we use to derive the values which drive the various heuristics in VMs) from validation suites (on which we report actual benchmarking numbers).
-
We need far, far more benchmarks than we currently have, and we have to keep adding benchmarks. In nearly all cases, the more benchmarks we have, the less likely we are to mislead ourselves12. My vague guess is that our current benchmark suites are perhaps an order of magnitude too small. But even much larger benchmark suites won’t solve the problem alone: fixed-size benchmark suites become gradually less useful as a VM matures, because the VM becomes more heavily trained towards (or, in a sense, “innoculated against”) the same old benchmarks.
-
I suspect most users would be happier if we worried more about predictable performance (both making sure that most programs run quite fast, and that programs run at more-or-less the same speed when you rerun them) than we did about peak performance (which currently dominates our thoughts). Put another way, we need to accept that optimisations often come with trade-offs: some appealing optimisations, for example, are highly non-deterministic and may make performance worse almost as often as they make it better.
A big question is whether fixing existing VMs is practical or not. I must admit that the current signs (including some work that I’ve been involved in) aren’t hugely positive in that regard. Most VMs are large (typically hundreds of thousands of lines of code), mature (many people have worked on them, over many years), and complex (squeezing every last bit of juice out of programming language and hardware). Subtle assumptions, both explicit and implicit, are spread throughout and across the codebase — and many of those assumptions have been forgotten (generally, though not exclusively, because people have moved on). Hunting down performance problems thus often devolves into wild stabs in the dark, looking for clues almost at random throughout large, complex codebases. Perhaps unsurprisingly, such hunts fail more often than they succeed.
However, I remain optimistic. First, I think we will start to see a gradual improvement in current VMs. Second, even despite the various problems I’ve detailed, many users are already fairly happy with their VMs: any improvements we make can only make them happier (and, if we’re lucky, make a few unhappy people happy). Speaking very personally, I still think that we don’t really know what the performance ceiling of dynamic compilation is. It is possible that we’re very close to the best performance possible, although my gut feeling is that there’s significant untapped potential. To that end, I’m now working on a new VM research project. It’s far too early to say anything useful about that work yet, and who knows what will happen with funding and the like, but maybe one day it’ll help nudge the field forward a little bit further.
Finally, if you want to repeat the warmup experiment, use Krun, or produce performance stats, then you can: everything’s under an open-source licence, so enjoy!
Acknowledgements: My thanks to Edd Barrett and Carl Friedrich Bolz-Tereick for comments on this blog post. This research was funded by the EPSRC Cooler (EP/K01790X/1) grant and Lecture (EP/L02344X/1) fellowship, and gifts from Cloudflare and Oracle Labs.
Footnotes
There are two main reasons for restricting things to these two VMs: not all VMs make such profiling information available; and the rest tend to have scant, or missing, information on how to access such features. HotSpot is an honourable exception (its well documented in this regard), but we only managed to get the numbers we needed out of PyPy because we had someone from the core team who we could prod for advice.
There are two main reasons for restricting things to these two VMs: not all VMs make such profiling information available; and the rest tend to have scant, or missing, information on how to access such features. HotSpot is an honourable exception (its well documented in this regard), but we only managed to get the numbers we needed out of PyPy because we had someone from the core team who we could prod for advice.
The cost of extra profiling information to record garbage collection data and JIT compilation can be quite significant — certainly significant enough that it can change the apparent performance of the main benchmark. It’s therefore vital that this extra information is recorded in a separate experiment, and doesn’t affect the main experiment.
The cost of extra profiling information to record garbage collection data and JIT compilation can be quite significant — certainly significant enough that it can change the apparent performance of the main benchmark. It’s therefore vital that this extra information is recorded in a separate experiment, and doesn’t affect the main experiment.
We couldn’t work out what the units for the PyPy profiling information are (they’re not documented, and it’s not obvious from the source code either): as we’ll soon see, that doesn’t matter much in this case.
We couldn’t work out what the units for the PyPy profiling information are (they’re not documented, and it’s not obvious from the source code either): as we’ll soon see, that doesn’t matter much in this case.
Unlike PyPy, the units for the garbage collection and JIT compilation sub-plots in HotSpot are clear and simple: seconds.
Unlike PyPy, the units for the garbage collection and JIT compilation sub-plots in HotSpot are clear and simple: seconds.
Sometimes it can feel like everyone, and in one or two cases even their dog, has tried making a Python implementation. Here’s an incomplete list of Python implementations (with thanks to Carl Friedrich Bolz-Tereick for pointing out several that I didn’t know about): CPython; IronPython; Jython; Nuitka; Psyco; PyPy; Pyston; Shed Skin; Stackless; Starkiller; TrufflePython; Unladen Swallow; WPython; Zippy.
Sometimes it can feel like everyone, and in one or two cases even their dog, has tried making a Python implementation. Here’s an incomplete list of Python implementations (with thanks to Carl Friedrich Bolz-Tereick for pointing out several that I didn’t know about): CPython; IronPython; Jython; Nuitka; Psyco; PyPy; Pyston; Shed Skin; Stackless; Starkiller; TrufflePython; Unladen Swallow; WPython; Zippy.
For those unfamiliar with this optimisation, consider this (contrived) code:
i = 0
while i < 2:
  f()
  i += 1
This can be “unrolled” (i.e. the loop can be expanded) to the equivalent:
f()
f()
In this case, the unrolled version is smaller and faster (since it has no branches). In more complex examples, unrolling can uncover optimisations that the loop would otherwise obscure.
The situation in a tracer is a little different: when you trace a loop, you effectively copy the trace (i.e. unroll it), with the first iteration “setting things up” for the second iteration. That’s not really equivalent to unrolling in the normal sense, though.
The situation in a tracer is a little different: when you trace a loop, you effectively copy the trace (i.e. unroll it), with the first iteration “setting things up” for the second iteration. That’s not really equivalent to unrolling in the normal sense, though.
Our aim here was to show that you could use warmup_stats without having to use Krun. We thus deliberately stuck to Octane’s behaviour – shared with many other benchmark suites – of running multiple benchmarks in a single process execution. It’s highly likely that benchmark ordering will have some impact on one’s perception of performance, but I have no idea to what extent. That’s for someone else to look into!
Our aim here was to show that you could use warmup_stats without having to use Krun. We thus deliberately stuck to Octane’s behaviour – shared with many other benchmark suites – of running multiple benchmarks in a single process execution. It’s highly likely that benchmark ordering will have some impact on one’s perception of performance, but I have no idea to what extent. That’s for someone else to look into!
In the end, I had to do a bit more than this, because the default Octane runner is written in a style that I found hard to follow. I ended up writing a new runner that dropped a couple of features, but was massively simpler.
In the end, I had to do a bit more than this, because the default Octane runner is written in a style that I found hard to follow. I ended up writing a new runner that dropped a couple of features, but was massively simpler.
Even worse, PdfJS isn’t even a very good way of benchmarking how a VM performs in a low memory situation, because it doesn’t hit that point until quite a long way in.
Even worse, PdfJS isn’t even a very good way of benchmarking how a VM performs in a low memory situation, because it doesn’t hit that point until quite a long way in.
Since I quickly exceeded the 90 second budget that PdfJS had led me to expect was reasonable for finding such bugs, I very quickly timed out in finding the cause of the leak.
Since I quickly exceeded the 90 second budget that PdfJS had led me to expect was reasonable for finding such bugs, I very quickly timed out in finding the cause of the leak.
The only quibble here is that if, somehow, you manage to have a large number of benchmarks which are either identical or extremely similar, you might end up with a skew towards a subset of a VM’s behaviour. Still, relative to where we are today, it’s a problem I’d be willing to risk.
The only quibble here is that if, somehow, you manage to have a large number of benchmarks which are either identical or extremely similar, you might end up with a skew towards a subset of a VM’s behaviour. Still, relative to where we are today, it’s a problem I’d be willing to risk.